Public School Data in New York State
The standardized tests in the US are administered by state education agencies (or local school districts) in order to measure academic achievement across multiple grade levels in elementary, middle and senior high school.
In New York State, the grades 3-8 English Language Arts (ELA) and mathematics assessments measure the higher learning standards and accurately reflect students’ progress toward college and career readiness.
We will apply demographic and school survey (school quality) data to predict the academic achievement of the school (Math Score). The data is from 2017, and the mean scale Math Score is from all students in grade 3-8 for each school.
Data are from two resources: New York City Department of Education and New York State Education Department (NYSED). NYSED provides demographic information for schools in New York State. While New York City Department of Education provides more information about school survey in New York City.
Response
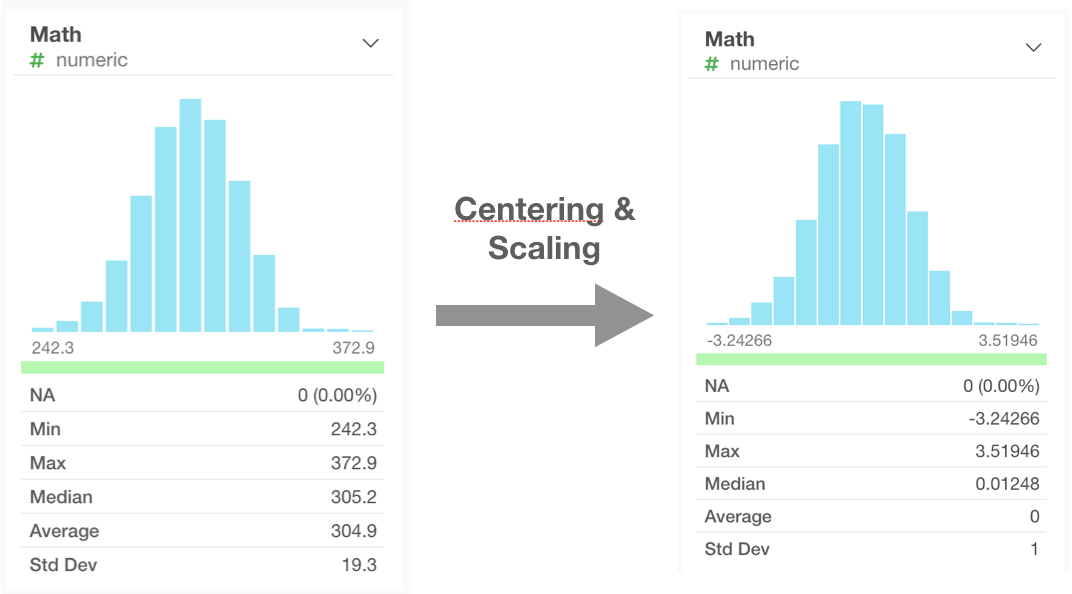
Here the Math Score is response. The scale scores range from 148 to 423, and we centered and scaled it as final response in the model.
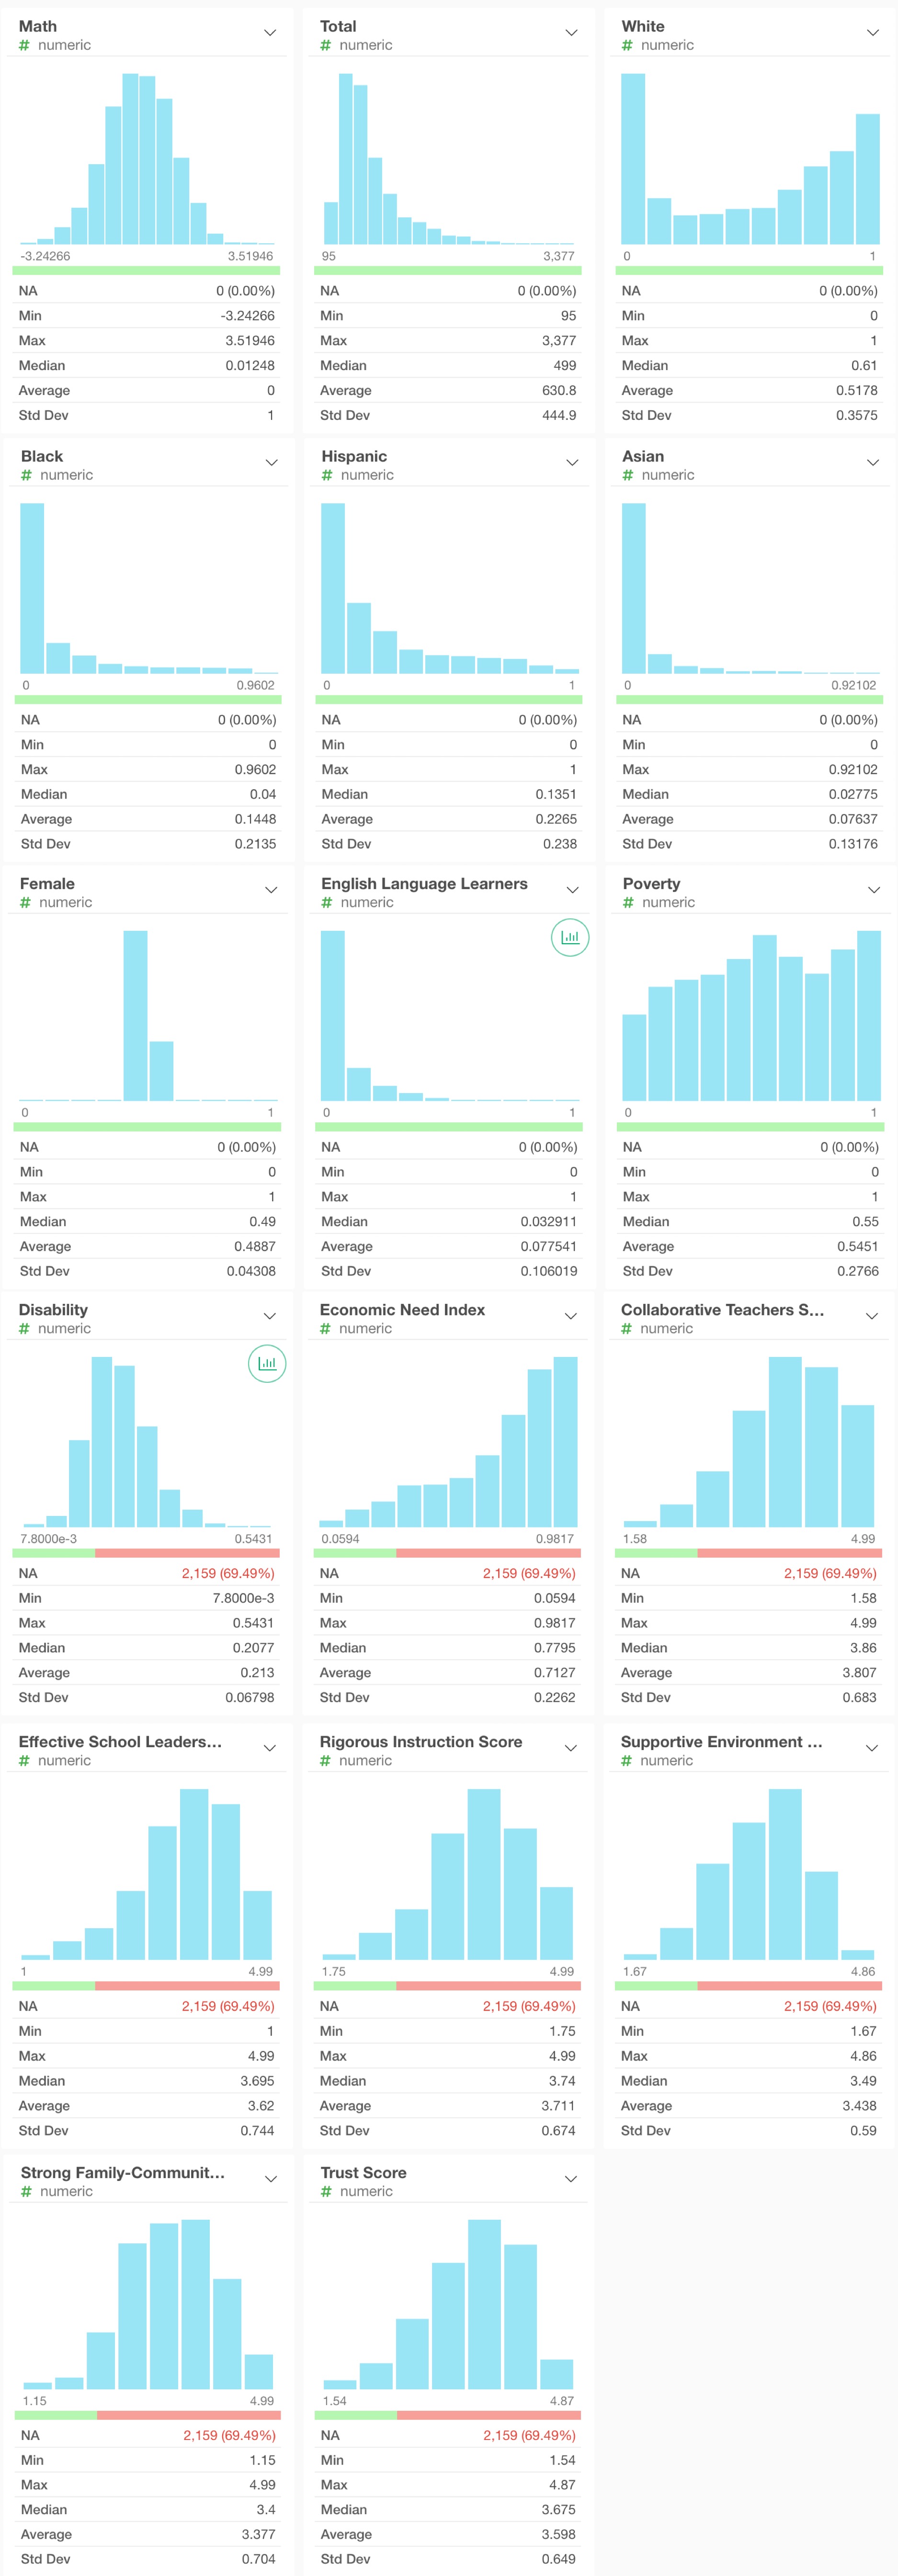
Predictors
The test results are correlated with student characteristics including disability status, English Language Learner (ELL) status, race/ethnicity, eligibility for free and reduced price lunch status, and gender.
School Survey variables capture the learning environment, school evaluations, student assessments and other scores. It utilizes feedback from students, teachers, and parents received through the annual NYC School Survey.
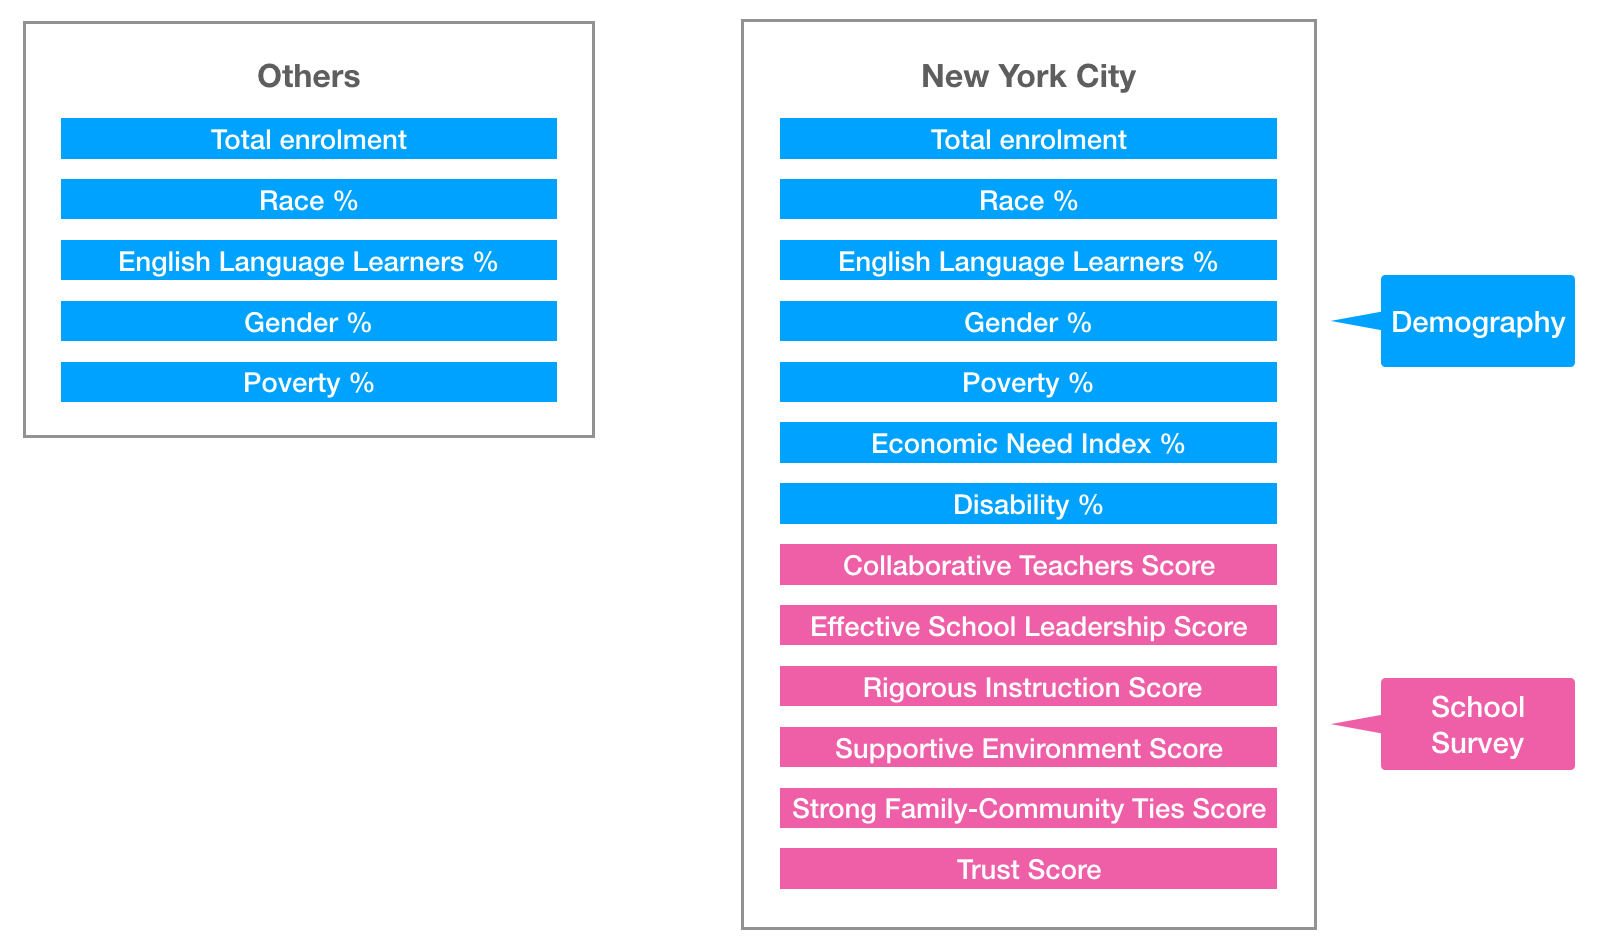
- Total: total student enrolled in school
- White: percentage of White
- Black: percentage of Black
- Hispanic: percentage of Hispanic
- Asian: percentage of Asian
- Female: percentage of female
- English Language Learners: Percentage of ELL
- Poverty: percentage of poverty, students’ family who have qualified for free or reduced price lunch, or are eligible for Human Resources Administration (HRA) benefits.
- Economic Need Index: ENI estimates the percentage of students facing economic hardship. The metrics include temporary housing, family income, public assistance and etc.
- Disability: percentage of disability, students who receive an Individualized Education Program (IEP)
- Collaborative Teachers Score: parents, teachers and students take the NYC School Survey and give their scores to the following six element about school.
- Effective School Leadership Score
- Rigorous Instruction Score
- Supportive Environment Score
- Strong Family-Community Ties Score
- Trust Score
Dimension
Data has 3107 rows and 17 columns where 948 rows for New York City schools and 2159 rows for other schools in New York State.
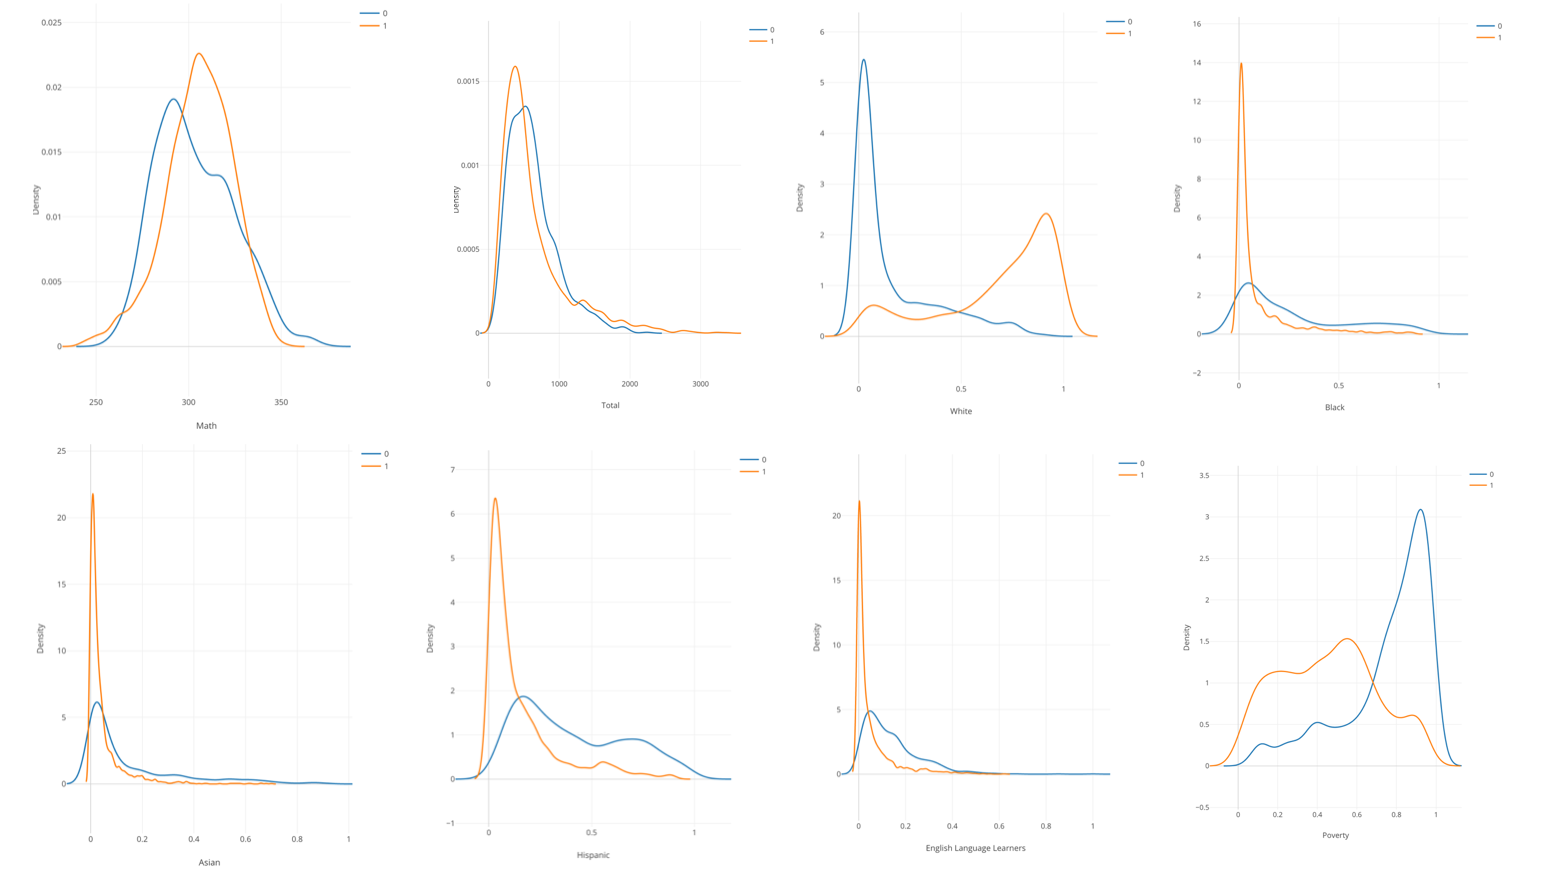
Missing Pattern
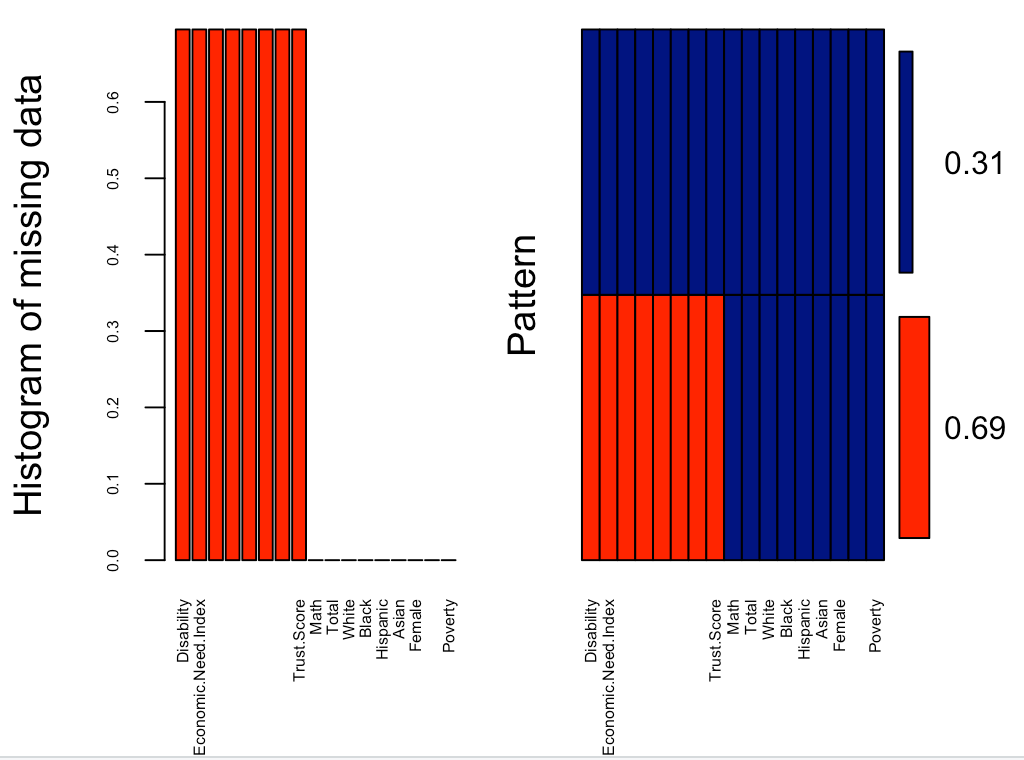
Complete cases vs Incomplete cases
- The blue line represents schools in New York City.
- The orange line represents other schools in New York State.
Correlation
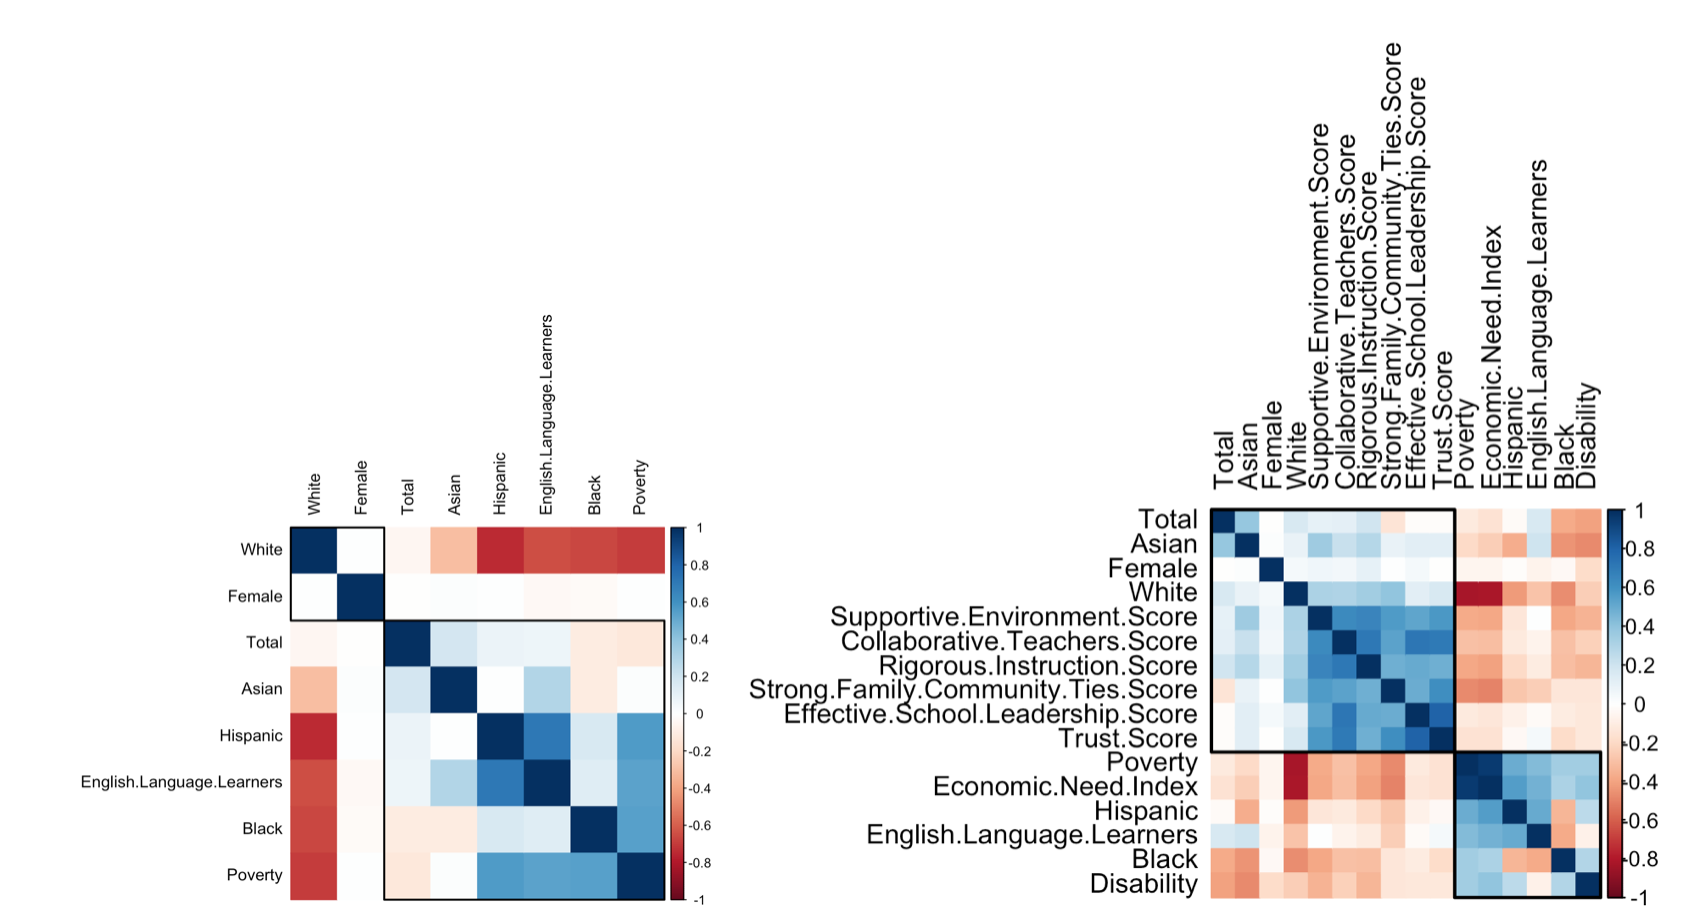
Linear models will be benefit from reducing the level of correlation between the predictors. We remove absolute pair-wise correlations greater than 0.82, which are Economic Need Index and Poverty.
descrCor <-  cor(Data,use = "na.or.complete")
summary(descrCor[upper.tri(descrCor)])
highlyCorDescr <- findCorrelation(descrCor, cutoff = .82)
Data <- Data[,-highlyCorDescr]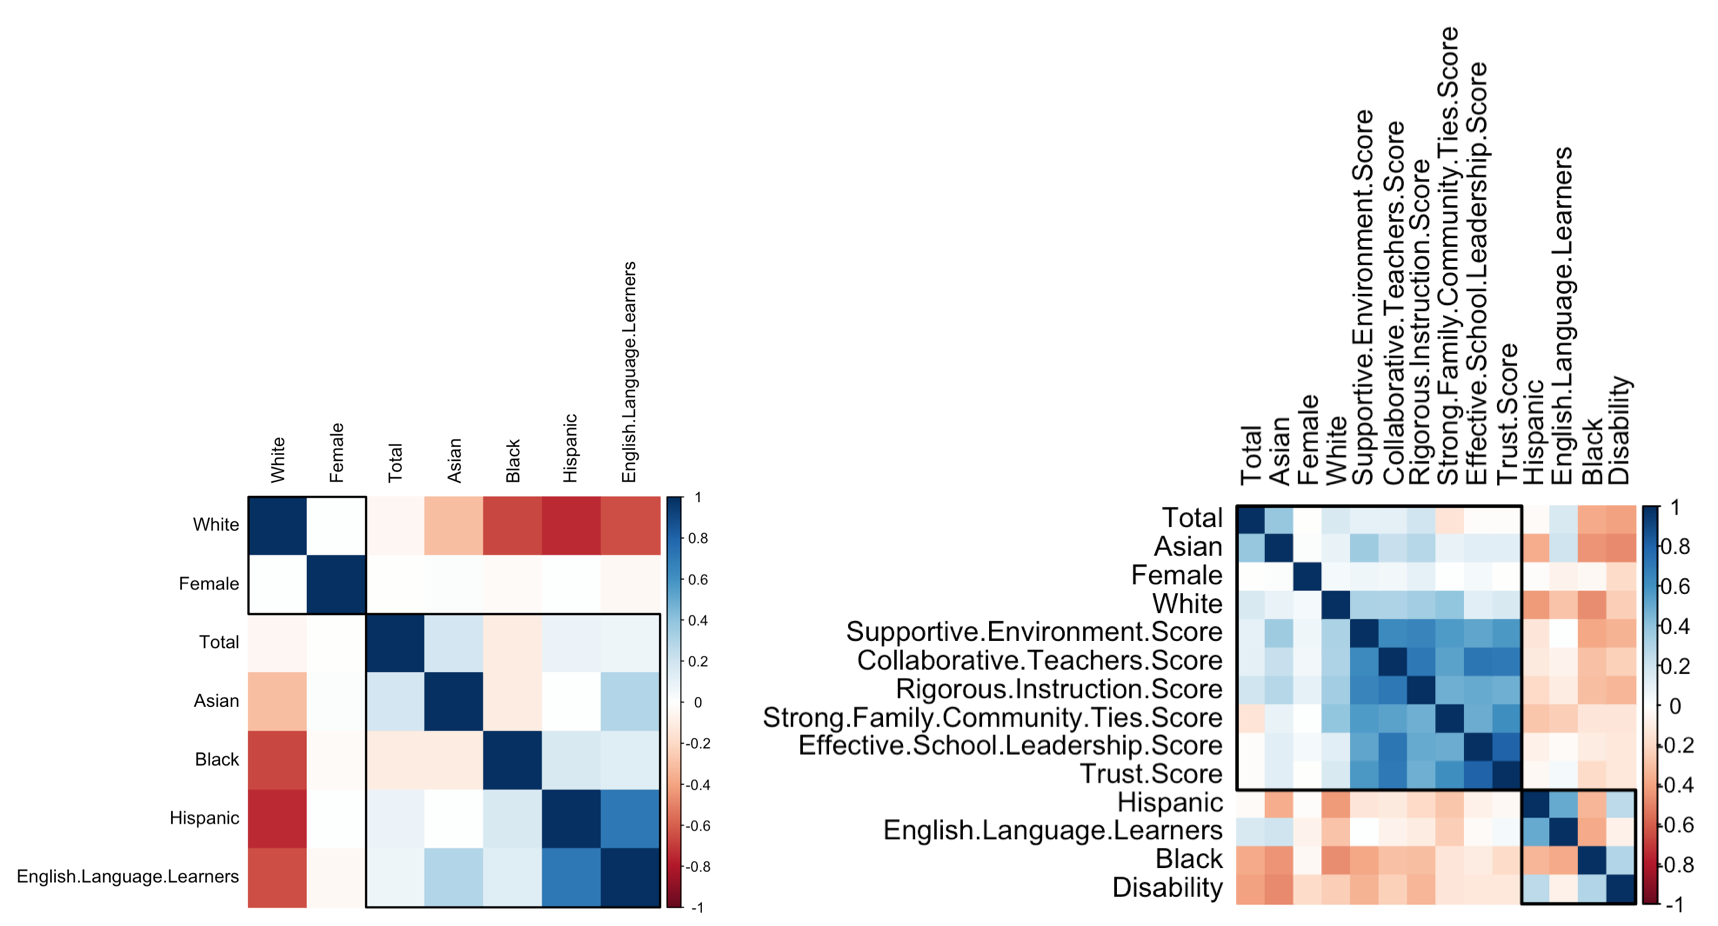
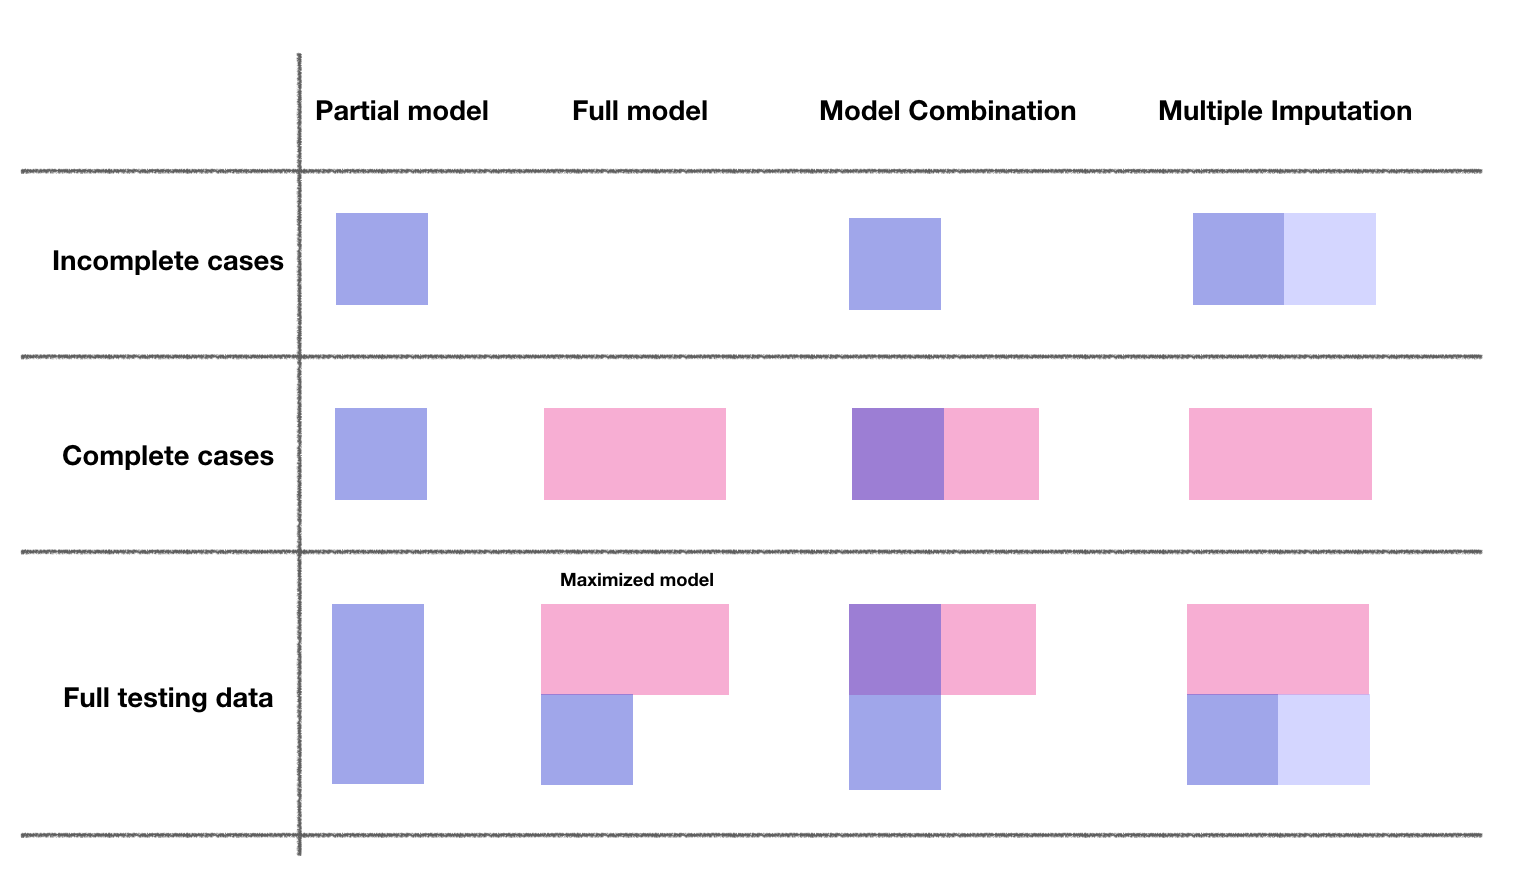
Model Combination
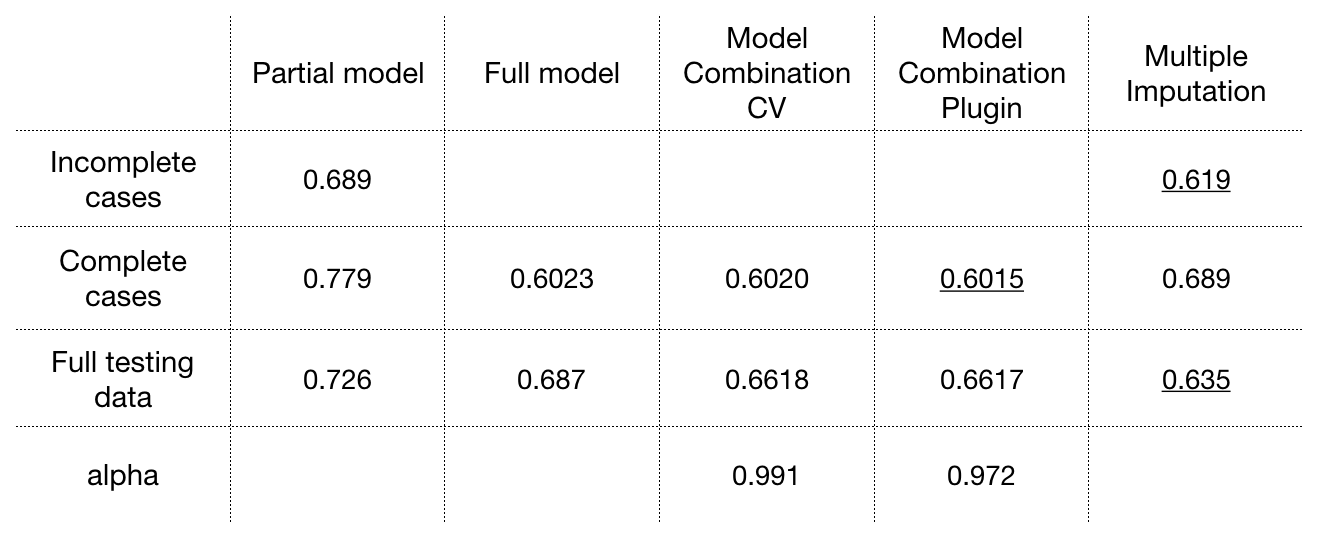
Linear Regression 1
RMSE result
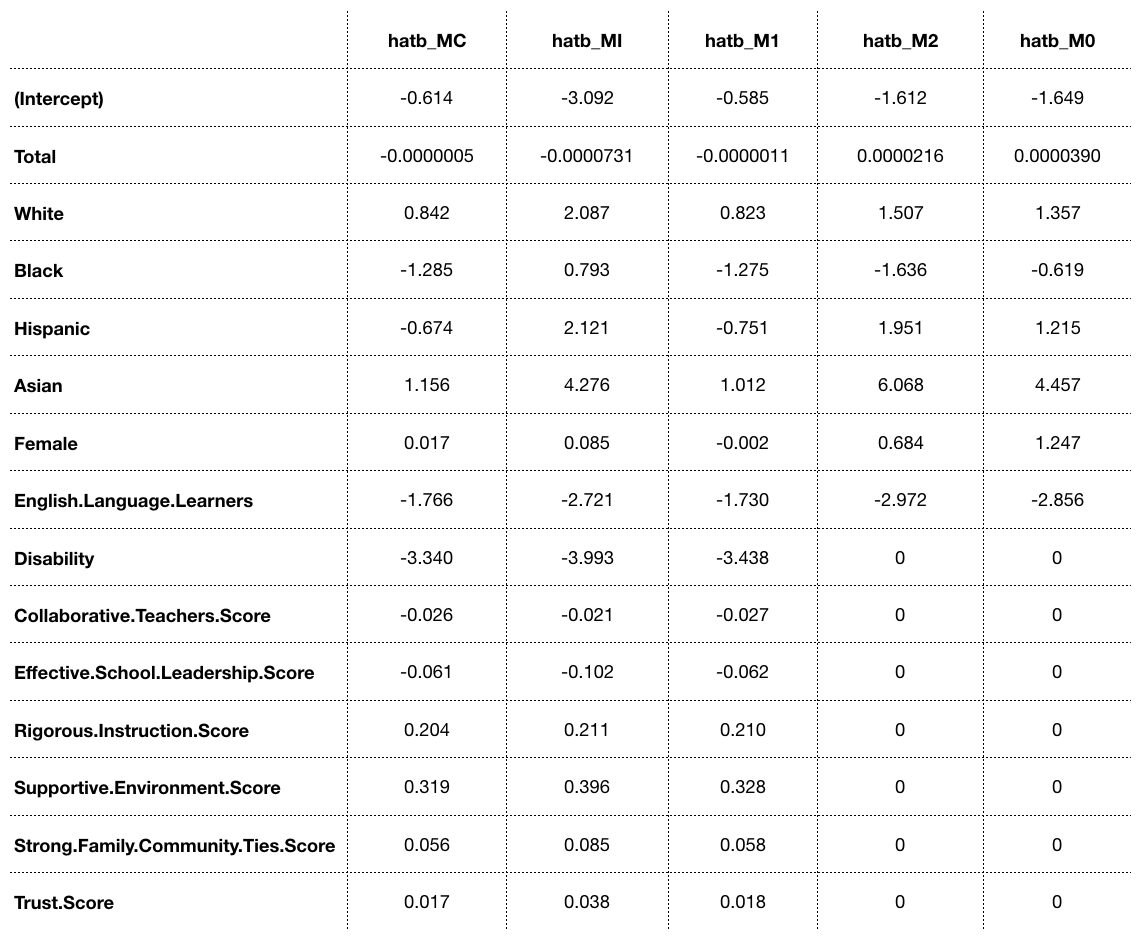
Coefficient
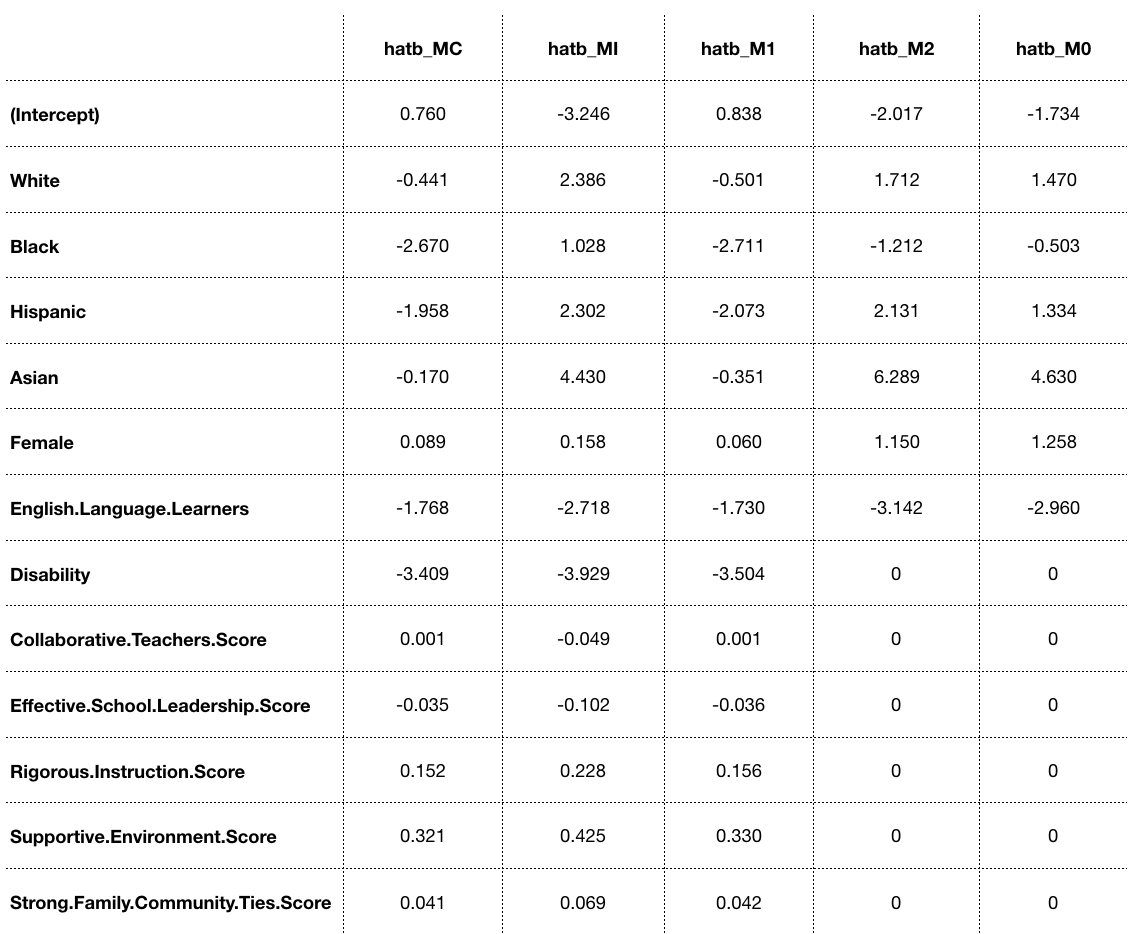
- hatb_MC: βModel Combination
- hatb_MI: βMultiple Imputation
- hatb_M1: βFull Model
- hatb_M2: βPartial Model without overlaps
- hatb_M0: βPartial Model with overlaps
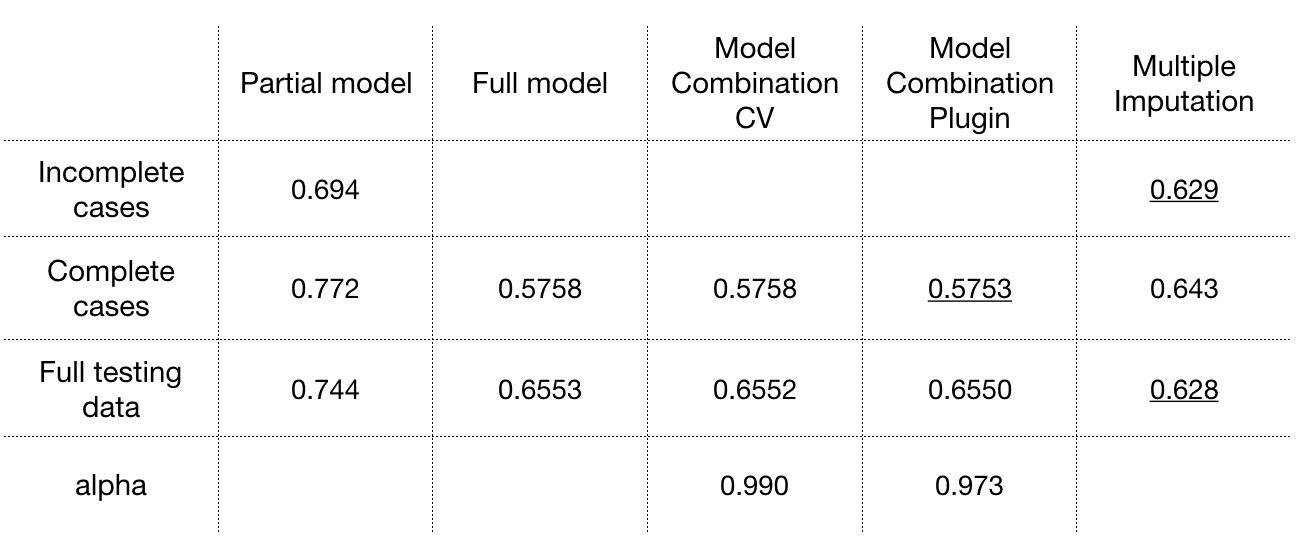
Linear Regression 2
Let’s remove absolute pair-wise correlations greater than 0.8, which are Economic Need Index, Poverty and Trust Score. Since Total predictor is not significant in above linear model, let’s remove it as well.
RMSE result
Coefficient
Conclusion
The Model Combination method performs superior than MI and Full model on complete cases. CV estimation and Plugin estimation works similar in the example. The RMSE of Model Combination on full testing data becomes greater because large percentage of incomplete cases are predicted by partial model with greater RMSE.